Available for freelance projects

Your data.
Clearer decisions.
Less busywork.

I’m Sanskar, a business analyst helping e-commerce and operations teams turn messy data into useful dashboards and automated reporting.

SQL · Python · Power BI · Google Sheets

FROM DATA TO DECISIONS
Sales Delivery Customer support
01 / BUILD THE FOUNDATION

Numbers you can trust.

✓ Define ✓ Clean ✓ Validate
02 / MAKE IT CLEAR

Useful dashboards

03 / KEEP IT MOVING

Automated reports

A practical process, from source to handover.

Experience across
growth, product & operations

Supertails Zomato Powerplay Bobble AI

01 / How I can help

Two ways to take work
off your plate.

For teams that need to understand their performance—and spend less time putting reports together.

01 ANALYTICS & DASHBOARDS

Know what’s happening.
Know where to act.

Bring sales, funnel or delivery data into one clear view, with consistent metrics and analysis that answers a real business question.

  • Power BI, Tableau, Superset or Sheets dashboards
  • KPI definitions and source-data validation
  • Funnel, cohort and operational performance analysis
  • Findings summary and a practical handover
Discuss a dashboard
02 REPORTING & AUTOMATION

Stop rebuilding
the same report.

Turn recurring exports and spreadsheet updates into a repeatable workflow, with clear logic and checks along the way.

  • SQL and Python data preparation
  • Scheduled database-to-Google Sheets reporting
  • Duplicate handling and tracking improvements
  • Workflow documentation and handover
Discuss an automation
ALSO EXPLORING

AI-assisted workflows. Have a repetitive summarization or reporting task? We can scope a small prototype with source checks and human review.

02 / Selected professional work

Business problems.
Practical analytics.

Examples from my work in growth, delivery operations and recurring reporting.

01 GROWTH & PRODUCT

ZOMATO

Understanding the funnel.
Planning for peak demand.

Used SQL and Python to prepare large datasets, analyze conversion funnels and cohorts, and support festival planning with historical trends and forecasting.

SQL & Python Cohort analysis Forecasting
Read the work summary

The business question

Where do customers drop out of the order funnel, how does performance vary by city and cohort, and what can historical demand tell us about peak periods?

My contribution

Cleaned and validated data, built granular funnel trackers, examined cohort-level differences, and developed campaign dashboards and festival-planning analysis.

The deliverable

Decision support for growth and campaign teams: performance trackers, segmented reporting and demand-planning analysis.

02 OPERATIONS ANALYTICS

SUPERTAILS

Making delivery
performance measurable.

Defined delivery-promise and SLA breach logic, reconciled shipment-level results, and compared courier and city performance across reporting periods.

SQL Metric validation Delivery SLAs
Read the work summary

The business question

Are deliveries meeting the promise made to customers, and are comparisons consistent across delivery types and reporting windows?

My contribution

Documented metric definitions and missing-value treatment, handled different promise cutoffs, and validated shipment-level calculations against source data.

The deliverable

Consistent month-to-date reporting and courier/city analysis that supports investigation of delivery delays.

03 WORKFLOW AUTOMATION

SUPERTAILS

From repeat exports
to scheduled reporting.

Built Python workflows that pull operational data from a database, refresh Google Sheets, and append new customer-support tickets without duplicating existing records.

Python MySQL Google Sheets Scheduling
Read the work summary

The business question

How can operational teams receive refreshed reporting and new ticket records without repeating the same extraction and spreadsheet steps?

My contribution

Built database queries and Python transformations, added ticket-ID deduplication, and scheduled daily jobs on a virtual machine.

The deliverable

Recurring reporting workflows and a ticket-tracking sheet that appends newly identified records.

Professional work summaries. Employer datasets and internal dashboards are not published here.

03 / Independent projects

A little more under the hood.

Personal projects exploring dashboards, prediction, recommendations and applied machine learning.

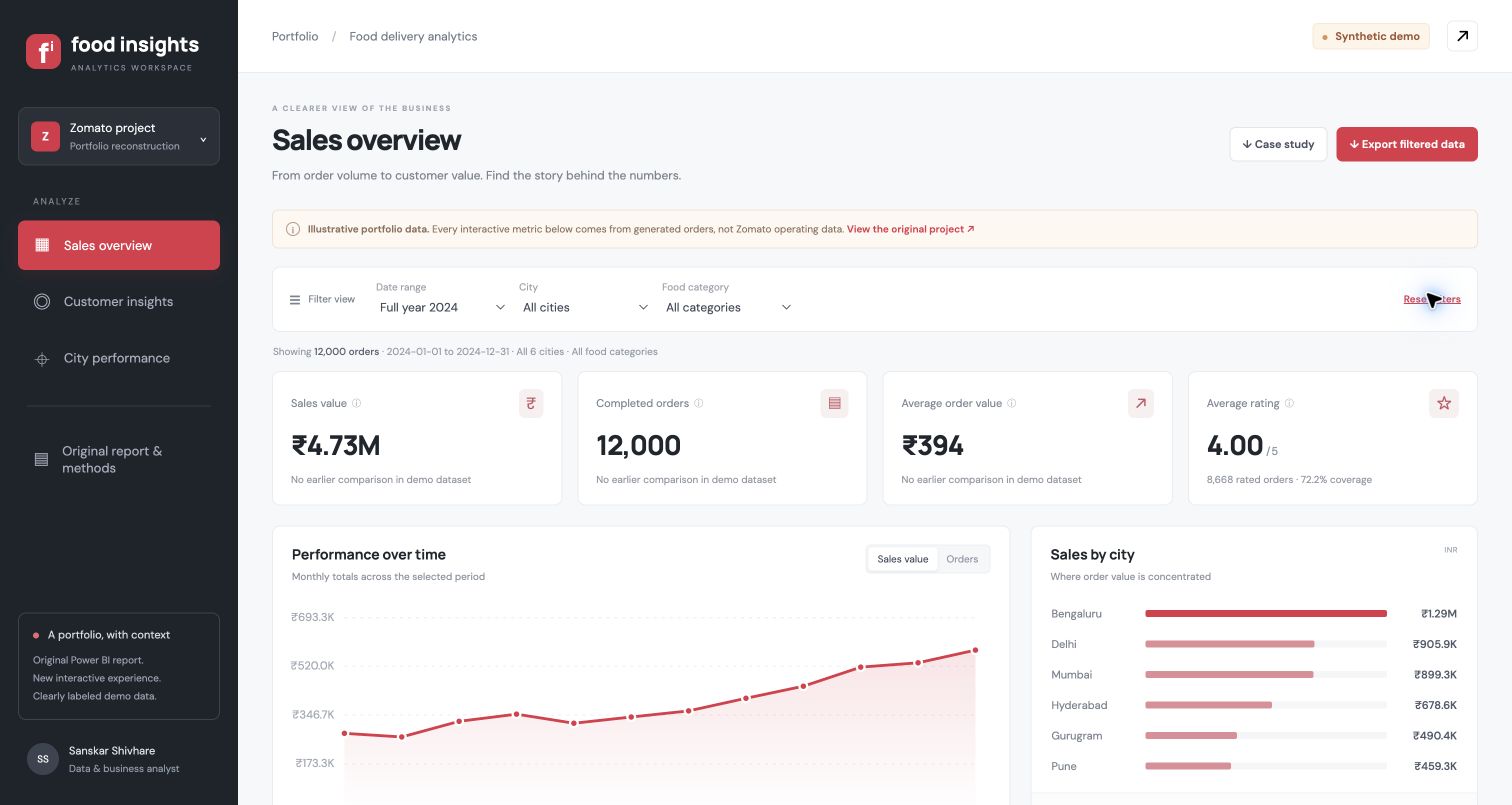
Food delivery sales dashboard with labeled synthetic portfolio data

DASHBOARD CASE STUDY

Food Delivery Analytics

A Zomato-inspired portfolio reconstruction exploring sales, customer cohorts and city performance with clearly labeled synthetic data.

Explore the case study ↗
Housing project illustration

PREDICTIVE ANALYTICS

Gurgaon House Prediction

A housing-price prediction project exploring data preparation, feature selection and regression.

View project on GitHub ↗
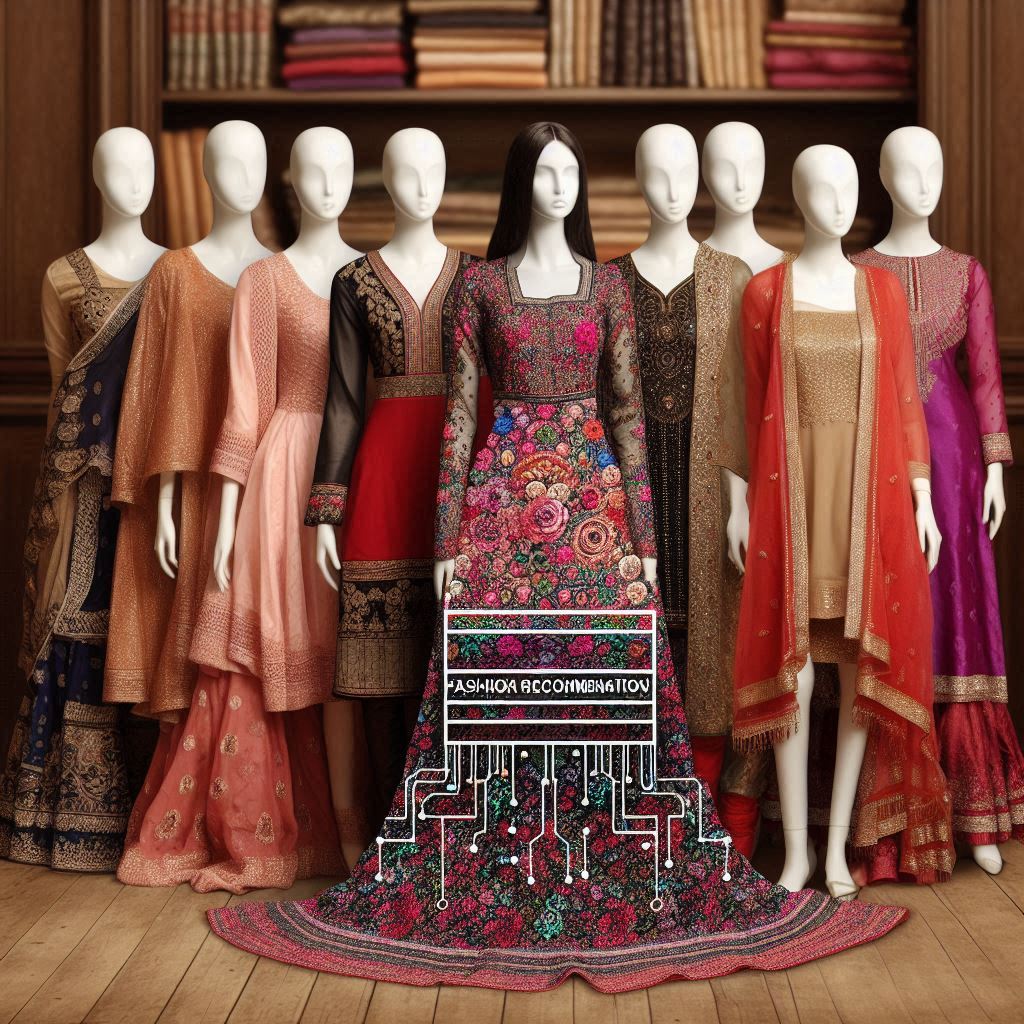
Fashion recommendation project illustration

RECOMMENDATION SYSTEMS

Fashion Recommender

An independent project exploring recommendations for fashion products.

View project on GitHub ↗
Credit risk project illustration

APPLIED MACHINE LEARNING

Credit Risk Modeling

A personal modeling project focused on credit-risk analysis.

View project on GitHub ↗

04 / Working together

Clarity at every step.

More about me ↗
  1. 01

    Start with the decision

    Define the business question, available data and what a useful result looks like.

  2. 02

    Build and validate

    Agree the metrics, check the source data and review the first version together.

  3. 03

    Make it usable

    Deliver the dashboard or workflow with documentation and a clear handover.

Have a reporting bottleneck?

Let’s make your data
work for your business.

Tell me about your project